Dispersant Dosage Calculation: A Surface-Area Method
Dispersant Dosage Calculation: A Surface-Area Method ! Decorative title card illustration for dispersant dosage article Start with pigment surface area, not a percentage from a spec sheet.
Start with pigment surface area, not a percentage from a spec sheet. For electrostatically stabilized systems, the industry starting benchmark is approximately 0.5 mg dispersant per m² of pigment surface; for sterically stabilized systems, the benchmark rises to roughly 4 mg/m². From there, the calculation moves in two steps: multiply that mg/m² figure by the pigment's BET surface area (m²/g) to get mg dispersant per gram of pigment, then scale that figure against your batch mass to get %wt.
- Electrostatic systems: recommended around 0.5 mg/m² starting point
- Steric systems: recommended approximately 4 mg/m² starting point
- Next step: convert mg/m² → mg/g pigment (using BET) → %wt in batch
- Then verify: confirm the calculated dose against a ladder study viscosity minimum
Astra Chemical supplies BET data on request for its ASTRA DISP® line and supports customers running these calculations against their own pigment lots.
Key Takeaways
Dispersant dosage calculation starts with pigment surface area and a stabilization-specific mg/m² benchmark, then requires lab viscosity verification to confirm the true optimum.
| Point | Details |
|---|---|
| Start with surface area | Use roughly 0.5 mg/m² for electrostatic systems and around 4 mg/m² for steric systems as initial calculation baselines. |
| Convert through three steps | Go from mg/m² to mg per g pigment using BET, then correct for % active, then scale to %wt in batch. |
| Verify with a ladder study | Run the calculated dose as the mid-point and confirm the viscosity minimum empirically. |
| Watch for reagglomeration | Recheck viscosity after 24 to 48 hours of storage to catch dosing errors a single-pass reading misses. |
| Get pigment-specific BET support | Astra Chemical provides BET data and dosage guidance for its ASTRA DISP® dispersant line on request. |
The core formula converts a surface-area target into a weight-basis dose you can actually pipette or weigh out on a bench scale.
Required dispersant (mg per g pigment) = Target mg/m² × Pigment surface area (m²/g) ÷ 1,000
The division by 1,000 exists because mg/m² multiplied by m²/g yields mg per kg of surface treated at unit scale; the correction brings it back to a workable mg-per-gram figure once you track units carefully. Always run a dimensional check before trusting the output: mg/m² × m²/g cancels the m² term, leaving mg/g, which is exactly what you want.
Once you have mg dispersant per gram of pigment, scaling to batch weight percent follows a second formula:
%wt in batch = (mg dispersant per g pigment × grams of pigment in batch) ÷ Total batch mass (g) × 100
Three unit pitfalls trip up formulators more than anything else:
- Active fraction correction. If your dispersant product is supplied at 40% active solids rather than 100%, divide your calculated "pure dispersant" mg figure by the active fraction (0.40) to get the actual product mass needed.
- BET units. Confirm the pigment's surface area is reported in m²/g, not cm²/g or ft²/lb; a misread unit throws the whole calculation off by orders of magnitude.
- mg vs. g confusion. Keep dispersant quantities in milligrams through the intermediate steps and convert to grams only at the final batch-scale step.
| Conversion Step | Formula | Typical Unit Trap |
|---|---|---|
| mg/m² → mg/g pigment | mg/m² × BET (m²/g) ÷ 1,000 | Wrong BET unit basis |
| mg/g → product mass | mg/g ÷ active fraction | Assuming 100% active |
| mg/g → %wt in batch | (mg/g × g pigment) ÷ total batch g × 100 | Mixing g and mg |
Pro Tip: Build these three formulas into a locked spreadsheet template with unit labels in every cell. Formulation teams that skip the active-fraction correction routinely underdose by 40 to 60 percent without realizing it, because they calculated for pure active material and ordered commercial-grade product instead.
Worked Examples for Common Pigments and Loadings
Real numbers make the formula concrete. The three cases below span the surface-area range formulators encounter most often: a moderate-surface inorganic, a high-surface organic, and an extreme-surface carbon black.
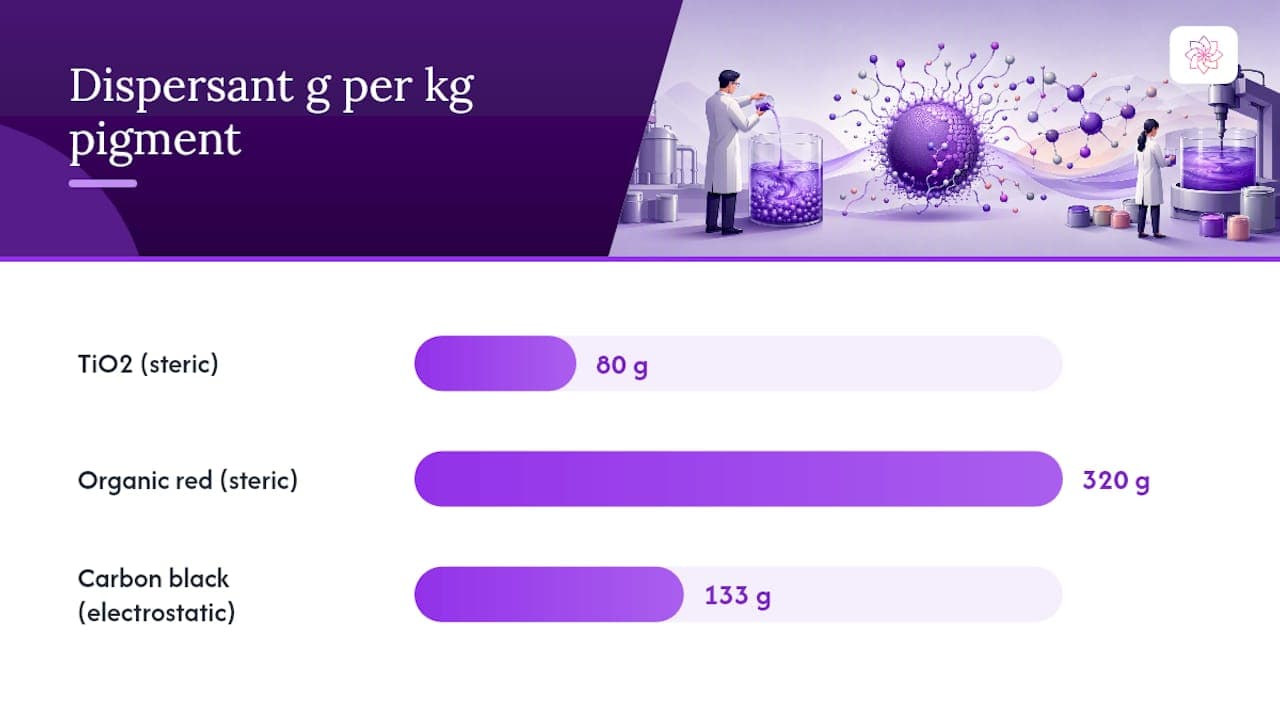
- Titanium dioxide (steric system). BET surface area of 10 m²/g, targeting the steric benchmark of 4 mg/m². That gives 4 × 10 ÷ 1,000 × 1,000 = 40 mg dispersant per gram of pigment. Correcting for a dispersant product at 50% active solids means 80 mg of product per gram of pigment. For 1 kg of TiO2, that's 80 g of product; in a 10 kg batch containing 3 kg of pigment, the dispersant contributes 2.4% wt.
- Organic red pigment (steric system). Higher BET at 40 m²/g pushes the load up sharply: 4 × 40 ÷ 1,000 × 1,000 = 160 mg/g pigment. At 50% active, that's 320 mg product per gram pigment, or 320 g product per kg pigment. In a 10 kg batch with 1 kg pigment loading, dispersant sits at 3.2% wt.
- Carbon black (electrostatic aqueous system). Extreme surface area of 80 m²/g, but electrostatic stabilization uses the lower 0.5 mg/m² benchmark: 0.5 × 80 ÷ 1,000 × 1,000 = 40 mg/g pigment. At 30% active, that's 133 mg product per gram pigment. For a 10 kg batch with 0.5 kg carbon black, dispersant lands near 0.67% wt.
| Pigment | BET (m²/g) | Target mg/m² | mg Dispersant/g Pigment | Product % Active | Product g Needed (per kg pigment) | %wt in 10 kg Batch |
|---|---|---|---|---|---|---|
| TiO2 | 10 | 4 (steric) | 40 | 50% | 80 g | 2.4% |
| Organic red | 40 | 4 (steric) | 160 | 50% | 320 g | 3.2% |
| Carbon black | 80 | 0.5 (electrostatic) | 40 | 30% | 133 g | 0.67% |
The pattern to notice: carbon black carries the highest surface area but the lowest calculated dose, because electrostatic dispersion in water needs far less polymer coverage per unit area than steric stabilization in solvent-based or high-solids systems. Choosing the wrong benchmark for the wrong stabilization mechanism is the single most common calculation error formulators make.
Verifying the Dose With a Ladder Study
The surface-area calculation gives you a defensible starting point, not a final answer. Prof. Steven Abbott's work on optimal dispersant concentration makes the case plainly: measured BET and effective wetted contact area often diverge from theory, so viscosity has to confirm what the math predicts.
- Use the calculated dose as the mid-point of a five- or seven-step ladder, spacing steps at roughly 25% intervals above and below it.
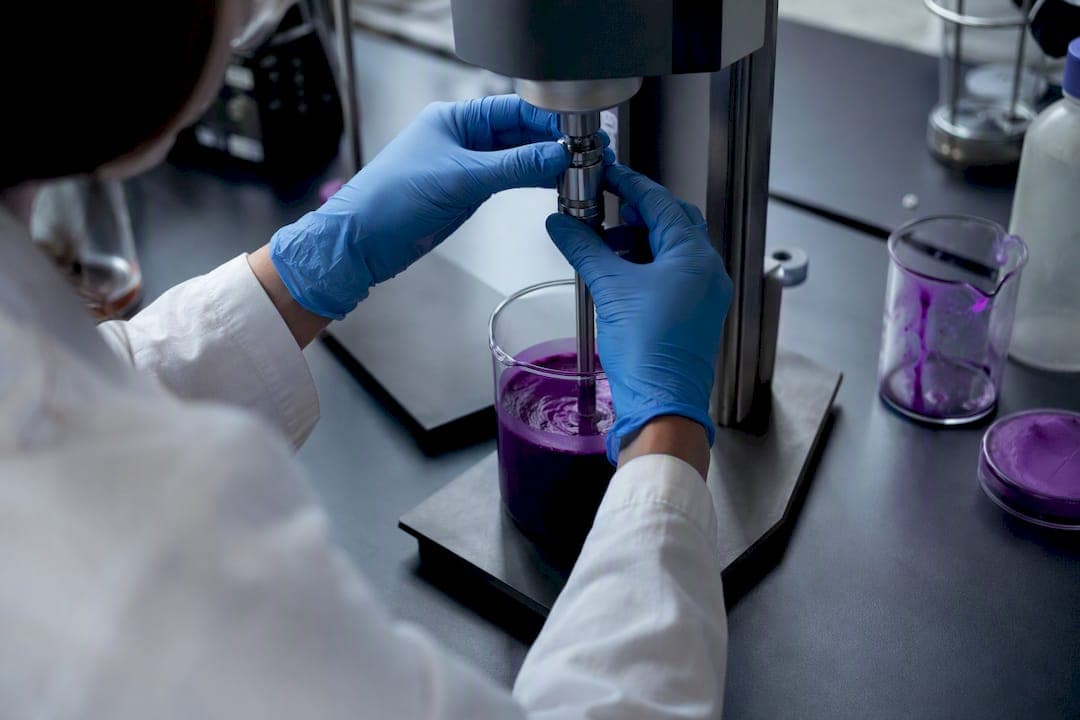
- Disperse each step under identical shear conditions, same mill or shaker, same bead size, same solids loading, same dispersion time.
- Measure viscosity on each sample using a Brookfield or cone-plate viscometer at a consistent shear rate.
- Plot viscosity against dispersant dose. The curve typically shows a clear minimum; that minimum is your empirical optimum dispersant concentration (ODC).
- Run a second viscosity check after 24 to 48 hours of static storage. If viscosity climbs again at the low-dose steps, reagglomeration is occurring, and Method B verification, extended dispersion with delayed viscosity monitoring, gives a more reliable demand figure than a single-pass reading.
A shaker-based screening test can cut comparison time significantly versus a small-media mill when you're screening multiple dispersant candidates before committing to a full ladder study on the front-runner.
Beyond viscosity, confirm dispersion quality with drawdowns and rubout testing, color strength development, gloss and haze readings, and a settling test over a defined storage window.
Pro Tip: Never compare ladder-study viscosities across batches milled on different equipment or bead sizes. A change in mill geometry alone can shift the apparent viscosity minimum by a full ladder step, making you chase a false optimum.
Common Dosing Mistakes and Scale-Up Notes
Overdosing shows up as foaming, higher water sensitivity, and softer, weaker films, not just wasted spend on a costly additive. Underdosing shows up as poor pigment wetting, flocculation, and color strength that never develops fully no matter how long you mill.
- Check pH sensitivity and ionic strength before adding an electrostatic dispersant to a formulation with high salt content or extreme pH.
- Match dispersant polarity to the solvent system; a dispersant built for waterborne systems rarely performs in a nonaqueous or high-solids resin.
- Add dispersant to the liquid phase before pigment introduction; reversing that order is a common cause of poor wet-out.
- When scaling %wt from lab batch to production, account for process losses in transfer lines and mixing vessels, and pull QC samples at multiple mill-time intervals to confirm the lab ODC holds at production shear rates.
Pro Tip: If viscosity behaves unpredictably at scale, check pigment surface area first (a new pigment lot can carry a different BET than the batch you calculated against), then dispersant activity, then actual mill residence time.
Getting Technical Support for Dispersant Selection and Dosing
Running these calculations in isolation only gets a formulation team partway there. Astra Chemical supports the full workflow: BET data on request, dosage calculation guidance specific to your pigment and resin system, and hands-on help interpreting ladder-study viscosity curves once your lab data comes back.

The ASTRA DISP® line covers both electrostatic and steric dispersion chemistries, with technical datasheets that include recommended starting mg/m² ranges by pigment class. Astra Chemical's technical team also works directly with formulation chemists on custom ladder-study design, on-site trial support for scale-up runs, and troubleshooting when a viscosity curve does not behave as the calculations predict. For teams evaluating a broader additive stack alongside dispersant selection, the coating additives guide covers how rheology modifiers and defoamers interact with dispersion chemistry.
The recommended path stays consistent regardless of pigment: calculate the theoretical mid-point from surface area, run the ladder study in your own lab under your own process conditions, and use Astra Chemical's technical support to interpret the results against your specific formulation. Request a technical consultation or pigment-specific samples through the ASTRA DISP® product page to get datasheet data and start a ladder study with the right starting point already in hand.
A note from Astra R&D Team
Surface-area calculation earns its place at the bench because it replaces guesswork with a defensible mid-point. Teams that skip straight to a supplier's suggested percentage range, without anchoring to pigment BET, tend to run wider and more expensive ladder studies than teams that calculate first. Reach out for formulation-specific case data if your pigment falls outside the ranges shown here.
Sources
- Determining the right dispersant level for your formulation
- Optimal Dispersant Concentration | Practical Coatings Science | Prof Steven Abbott
- Optimizing Dispersant Levels for Waterborne Pigment Color Concentrates | PCI Magazine
- Determining the optimal dispersant loading for pigments and fillers
FAQ
What Units Are Used for Dispersant Dosage?
Dispersant dosage is most often expressed as mg per m² of pigment surface area for calculation purposes, then converted to % weight (%wt) or parts per hundred resin (phr) for batch formulation.
How Do I Calculate Dispersant Dosage From Pigment BET?
Multiply the target mg/m² benchmark by the pigment's BET surface area in m²/g, divide by 1,000 to get mg dispersant per gram of pigment, then correct for the product's active fraction before converting to %wt.
What Is the Difference Between Electrostatic and Steric Dispersant Benchmarks?
Electrostatic systems typically need around 0.5 mg/m² because charge repulsion requires less polymer coverage, while steric systems need roughly 4 mg/m² to build a full protective layer around each particle.
How Do I Know If I've Overdosed on Dispersant?
Overdosing typically shows up as foaming, increased water sensitivity, and softer film properties rather than any improvement in dispersion quality beyond the true optimum.
Where Can I Get Pigment-Specific Dosage Guidance?
Astra Chemical provides BET-based dosage guidance and sample requests for its ASTRA DISP® dispersant line through direct technical consultation for pigment-specific formulations.
Recommended
Testing additives for this application?
Send us your current formulation challenge and our technical team will recommend an ASTRA product package for lab screening.